

Uploading Images
Images included in lab reports can be captured from a computer screen (e.g., Snipping Tool), mobile device, or uploaded files. Upload instructions are available under a "More Information" link on the lab page - kept in a collapsible section to save space and customizable by the instructor.
Draw the image
- Use web-based drawing program to create your answer.
- Draw the image on paper using ink or a Sharpie - do not draw your answer with a pencil.
Upload the image (web-based drawings)
- Open the Snipping Tool (click on the Start button and type Snipping Tool in the search box). For MAC OS press Command-Shift-F4 (screenshot) or use the Grab feature located in Applications → Utilities folder.
Snipping Tool Directions: - Use the Mode drop down menu (to the right of New) to select Rectangular Snip.
- Click and drag a rectangle to select just the image or portion of the screen that contains the image - don't include extra white space.
- Paste or Save / Upload your image file
- Paste (Chrome / Firefox browsers): click the Edit tab in the Snipping Tool. Click Copy. Click in the grey box below and press Ctrl-V simultaneously.
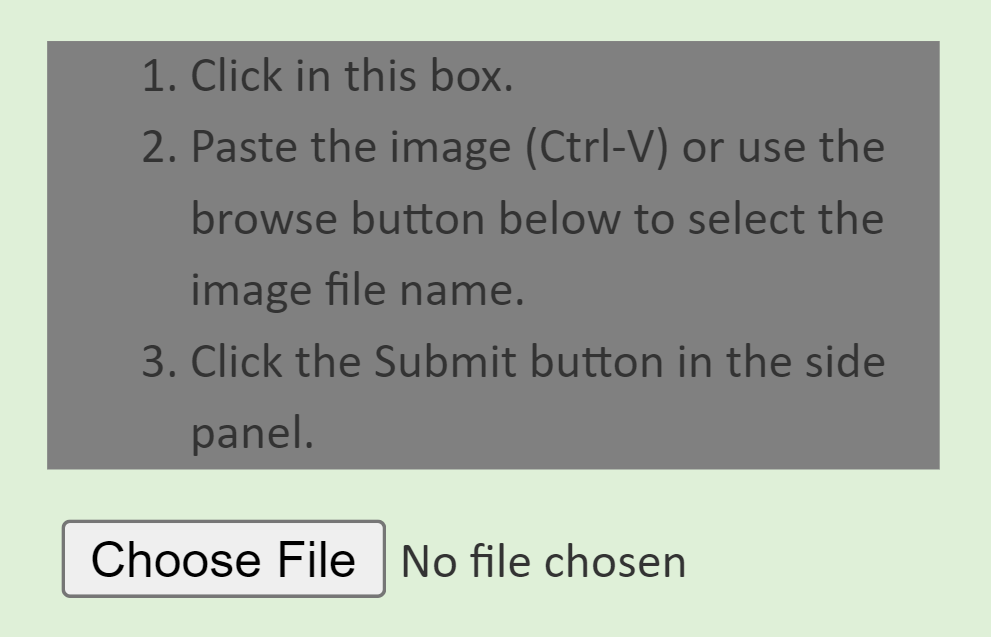
Non-working image of upload area. - Save/Upload: From the File menu on the Snipping Tool screen select Save As and save your file as a png. Upload the png file by clicking the Choose File button (above) and finding this image in your computer's file structure.
- Paste (Chrome / Firefox browsers): click the Edit tab in the Snipping Tool. Click Copy. Click in the grey box below and press Ctrl-V simultaneously.
- Complete the Upload by clicking the Submit button in the right side panel - the image will display in the space below.
Upload the image (hand drawings)
- Use your phone to take a picture of the image. Zoom in so that the image fills the screen.
- Log into your Chem21Labs account from your phone (open a browser, go to www.chem21labs.com and login).
- Upload the image from your phone by clicking the Choose File button below and find the image in your phone's photo album. If necessary, crop the photo to remove unnecessary white space or material.
- Alternatively, you can send the image to your email account, save the image to your computer's hard drive, and then upload the image from your computer to this webpage.
- Complete the Upload by clicking the Submit button in the right side panel - the image will display in the space below.
Rotate / Replace the image
- If the image is not oriented properly, use the Rotate Left and Rotate Right links.
- If you need to replace the image, use the Change Image link.
Your TA / Instructor will view this image after the last submission date has passed and enter a grade based on the work shown in the picture. Note: If the image or answer to this question isn't clear in the uploaded file, your Instructor / TA will not be able to award full credit for this answer. Here are some steps to take to make your image more readable:
- Enlarge the image on your computer screen so it fills most of the screen, then use the Snipping Tool to capture the image.
- Enlarge by pressing Ctrl and '+' keys simultaneously.
- Reduce by pressing Ctrl and '-' keys simultaneously.
- Return to 100% by pressing Ctrl and '0' keys simultaneously.
- Move hand-drawn images to an area with plenty of light and zoom-in when taking the picture.
Commonly uploaded images include:
- Lab Scavenger Hunt (safety equipment)
- TLC plates or paper chromatograms
- Buret readings and titration endpoints
- Lewis structures
- Sampling Site (e.g. water analysis)
- Flowchart and labeled Excel graphs
- Organic Mechanism and Syntheses
- Melting point verification
- Documentation of remote lab activities
Image grading is performed on a webpage similar to the essay grading interface.
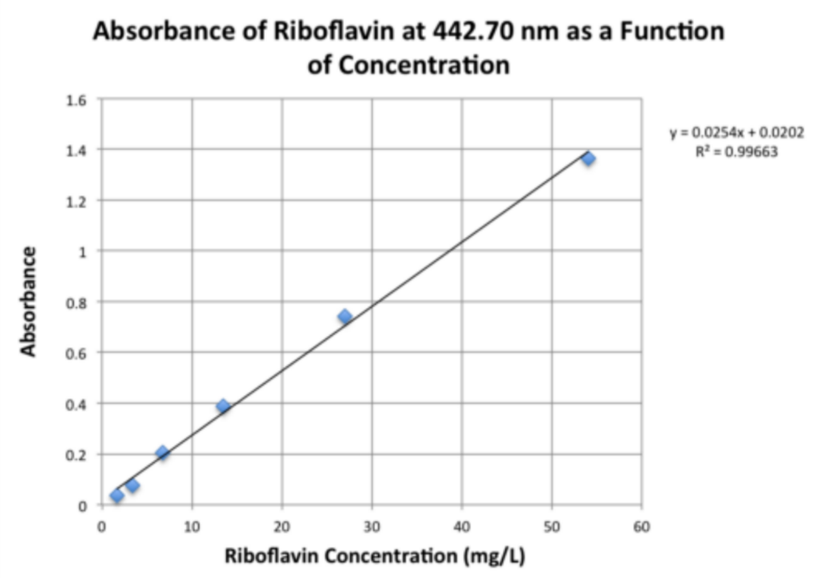
Excel Graph |
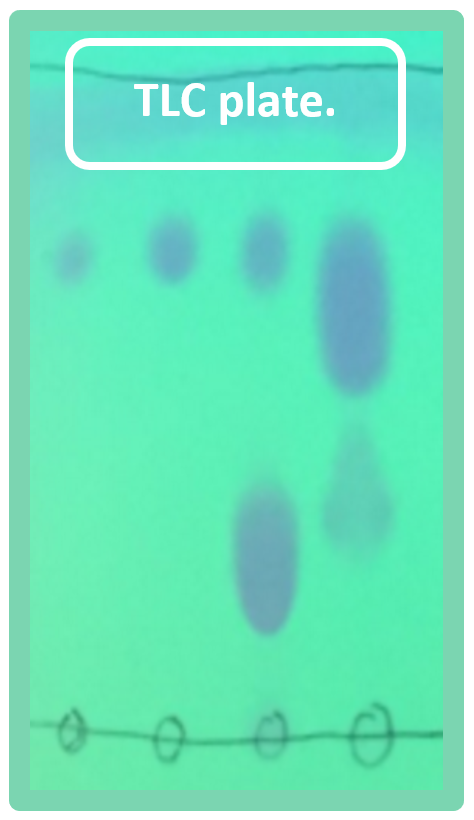
TLC Plate |
|
Although slope, y-intercept, and other values are graded automatically, most instructors review the final graph to ensure it is properly titled and axes are labeled. |
Upload an image of the silica or alumina plate (sample was photographed under UV light) to avoid handling the actual plate directly. |
|
|
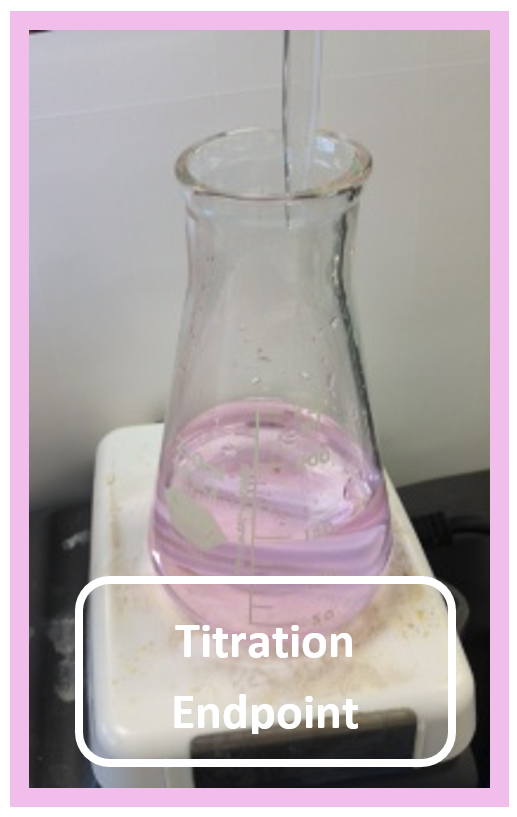
Titration Endpoint |
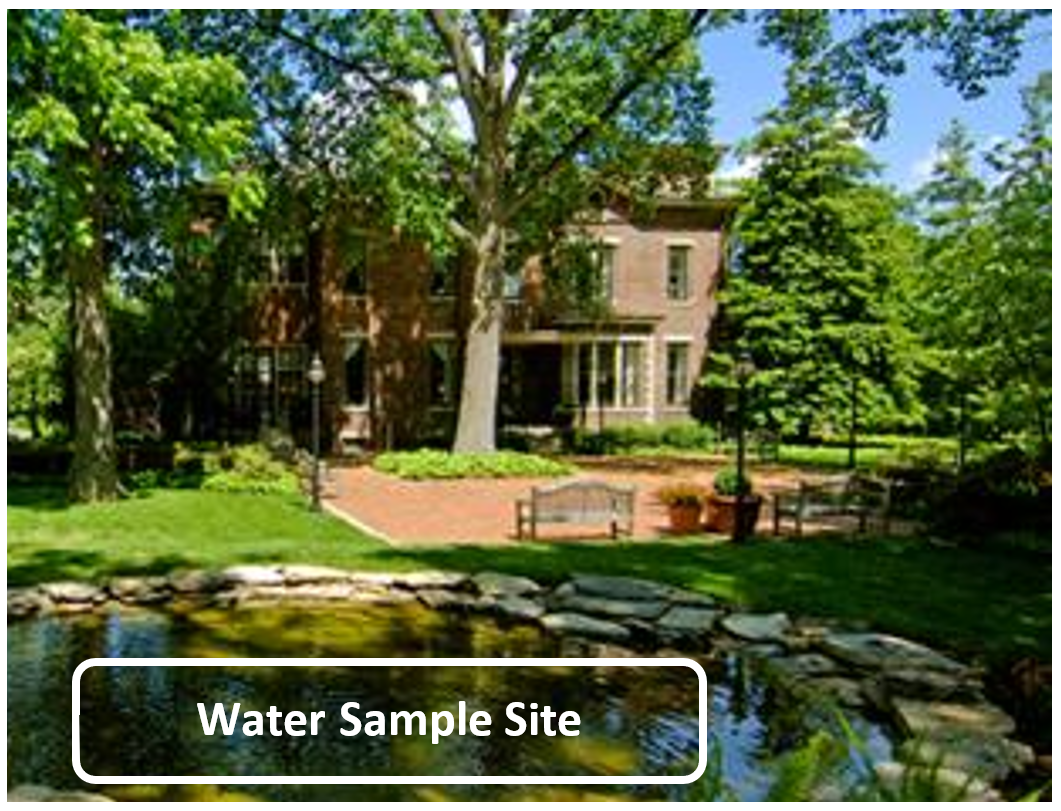
Water Sample Site |
|
The titration endpoint color can be graded by reviewing a photo of the student's flask at the endpoint. |
Students photograph the site where they collected a water sample for an analysis lab. |
|
|
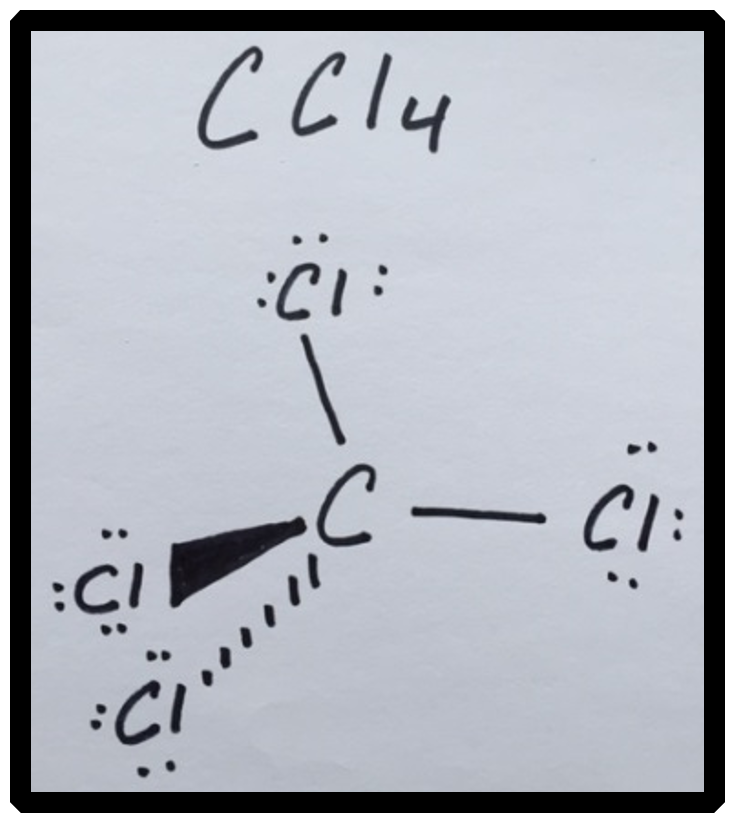
Lewis Structure |
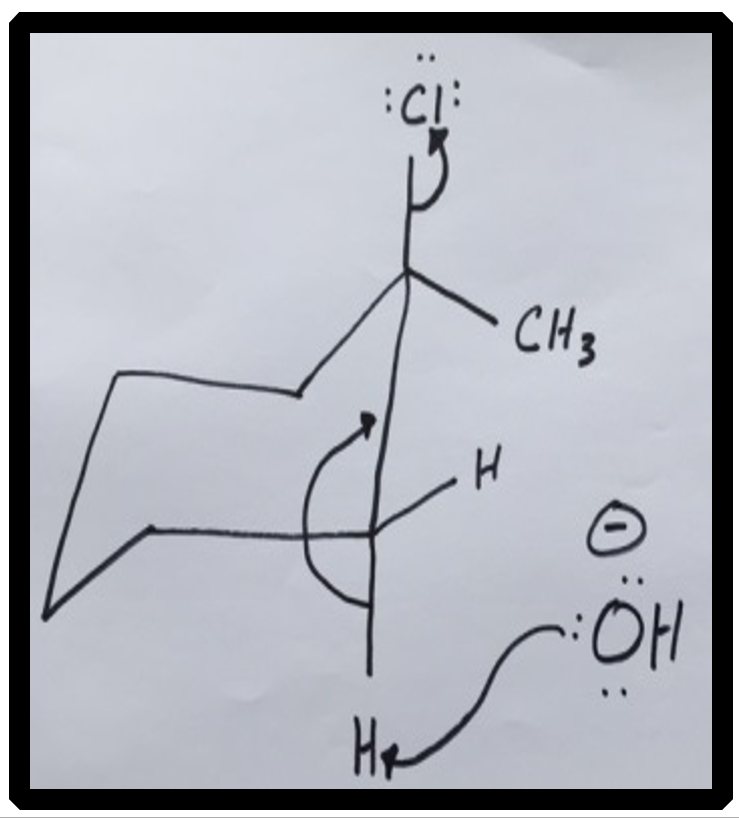
Organic Mechanism |
|
Students can upload a photo of a hand-drawn Lewis structure directly to their lab report. |
Students can upload a photo of a hand-drawn reaction mechanism directly to their lab report. |
|
|
Verification of Melting Point |
|
|
In Organic Chemistry, melting point range is a quick way to assess product purity, but self-reported values are often unreliable since expected ranges are usually known. Traditionally, a TA verifies each sample - a tedious process. An alternative: students photograph their compound and digital readout when melting begins and again at 95% melted, providing a record of the melting point. 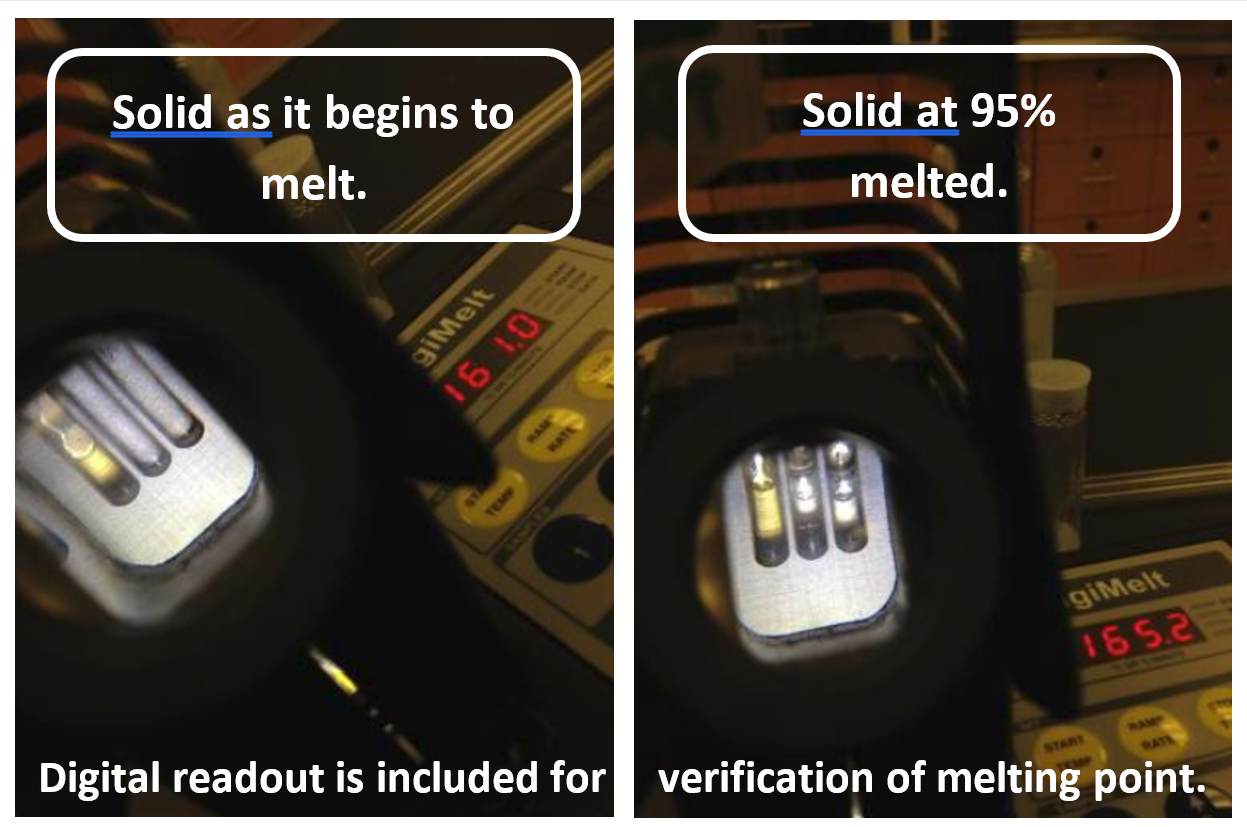
|
|