Submitting Lab Data
Chem21Labs collaborates with the university lab coordinator to convert existing lab reports into interactive, auto-graded webpages, giving students immediate feedback and multiple submission attempts.
Student Data
Student data - including mass, volume, temperature, pressure, concentration, pH, time, and absorbance - is entered according to the instructor's preference:
- Top-of-report entry: All data is entered in the lab data section and redisplayed throughout the report. This approach works well when data is entered online during lab and calculations are entered at the end or after lab.
- Staged entry: Data is entered as students work through each report section, typically followed by calculations, essays, multiple choice questions or balanced equations.
With either entry method, instructors can monitor class progress by refreshing the "lab data report" webpage.
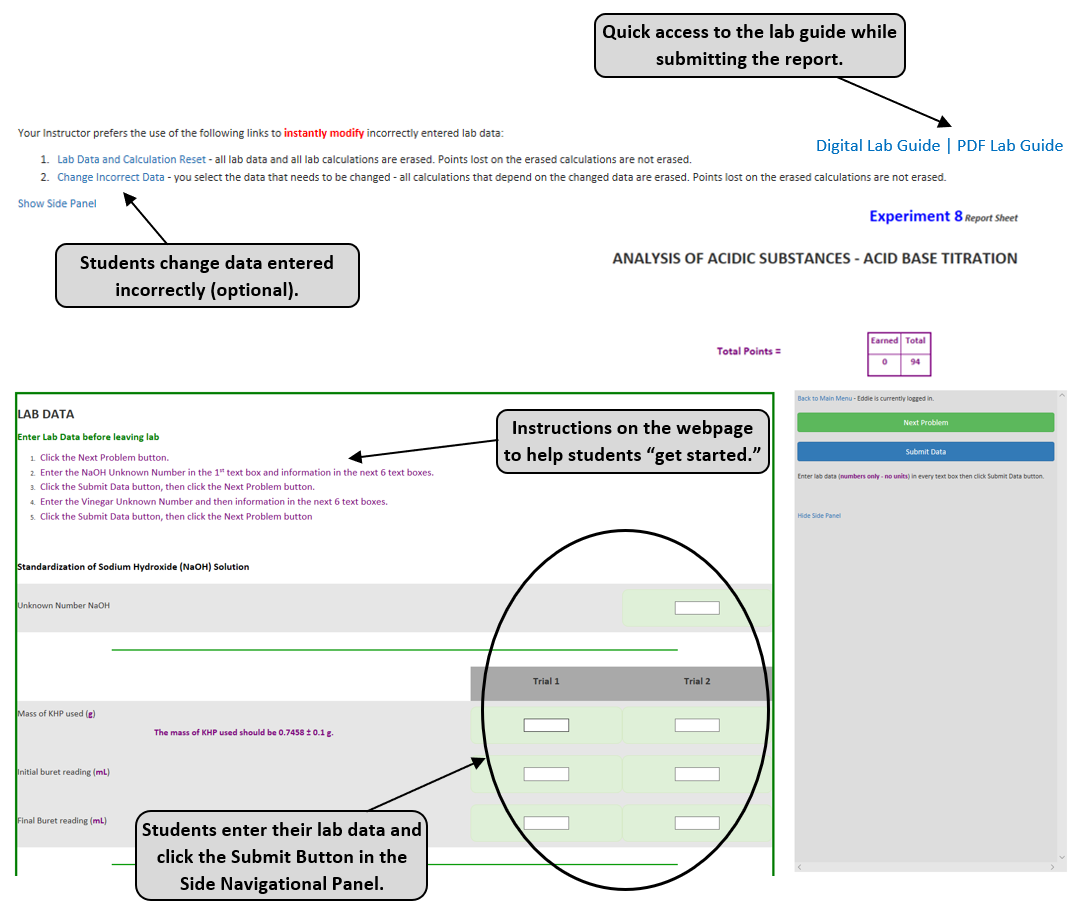
The image to the right shows grouped lab data entered at the top of the report. Key features include:
- Lab guide access: A webpage or PDF is linked at the top for easy reference.
- Easy data correction: Students can quickly fix errors without instructor/TA involvement; instructors can view a log of data resets if needed.
- Navigation support: Built-in instructions guide students through early labs.
- Data saving: The Submit Data button stores entries in the database.
- Range checks: Data is validated against expected ranges (e.g., ~2 g NaOH set to 1-3 g) to catch entry errors.
- Decimal checks: Required decimal places are enforced to ensure proper reporting (e.g., 1.980 vs. 1.98).
In both cases (e and f), the Side Panel prompts students to "double-check" their entries, while reminding them to report the data exactly as they recorded it during lab.
Class Data
A data array (pooled class data) can be entered by each student or once by the instructor. The program then calculates mean, min, max, and standard deviation and uses these values for grading.
Instrument Data
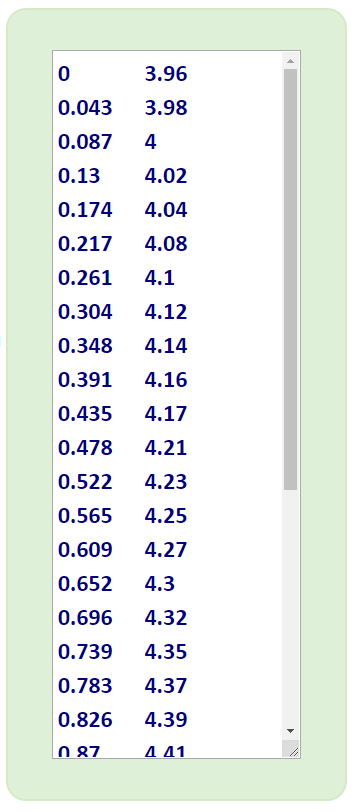
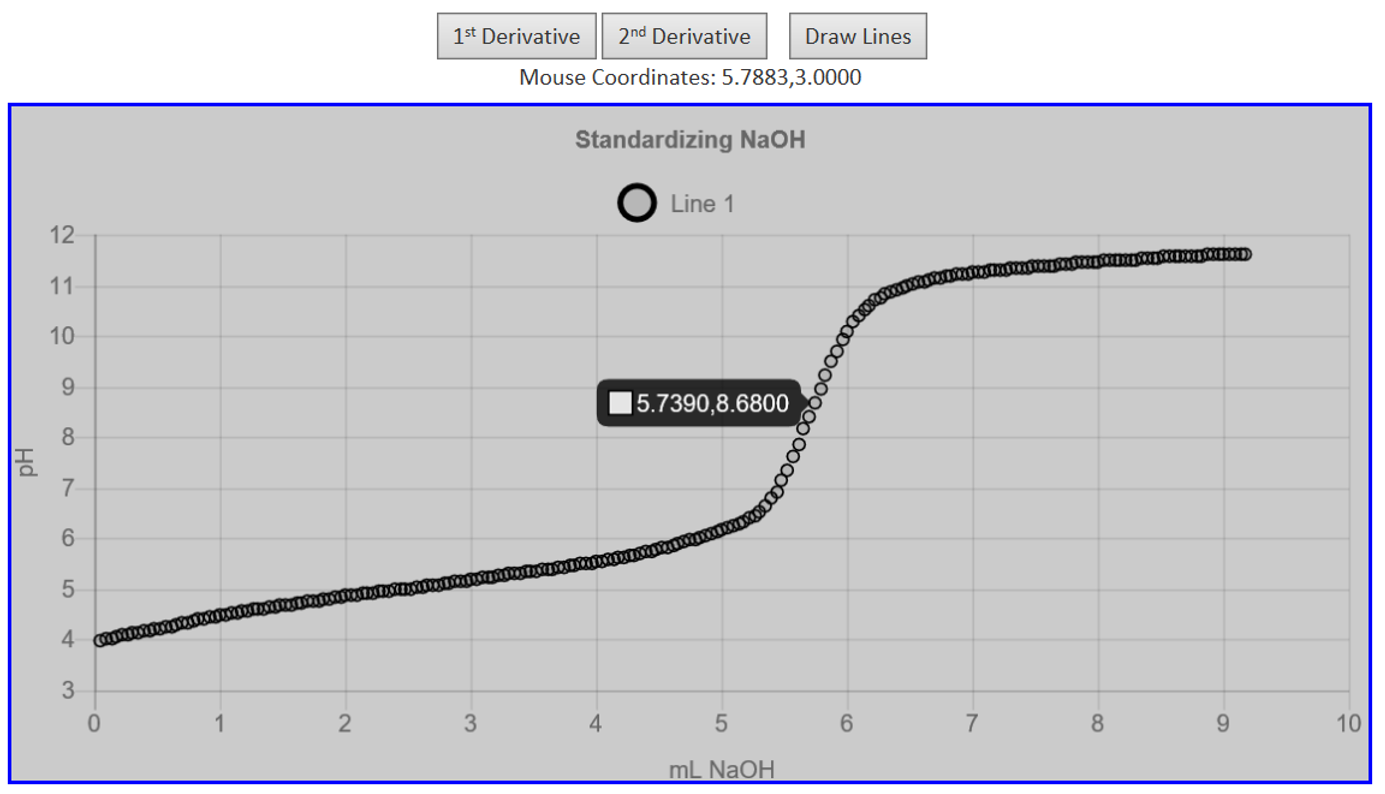
For instrument-based labs (e.g., pH meters, UV-Vis spectrometers, temperature probes), students can copy and paste x,y data into a text box. Chem21Labs parses and stores the data, then displays it as an interactive graph (pH curve, absorption spectrum, or temperature curve). Using the plot and guided instructions, students can recreate graphs and determine slope, y-intercept, R2, and standard deviation.
For pH data, students can also re-plot 1st and 2nd derivatives, view x,y coordinates via mousover tooltips, and draw lines on the graph to determine key values such as the equivalence point.